#cloud architecture #google cloud platform #automl #bigquery #cloud vision ocr #natural language api #document ai #cloud functions #data studio
Project Overview
Cloud-based architecture designed to process, analyze, and generate insights from structured and unstructured reports. Provides an automated pipeline that ingests multiple data types (PDF, Word, Excel, PNG, CSV, TIFF), extracts valuable insights using GCP AI services, and makes them accessible through dashboards and APIs for decision-making.
System Architecture
Complete cloud-based pipeline from multi-format data ingestion through AI processing to insight visualization and retrieval.
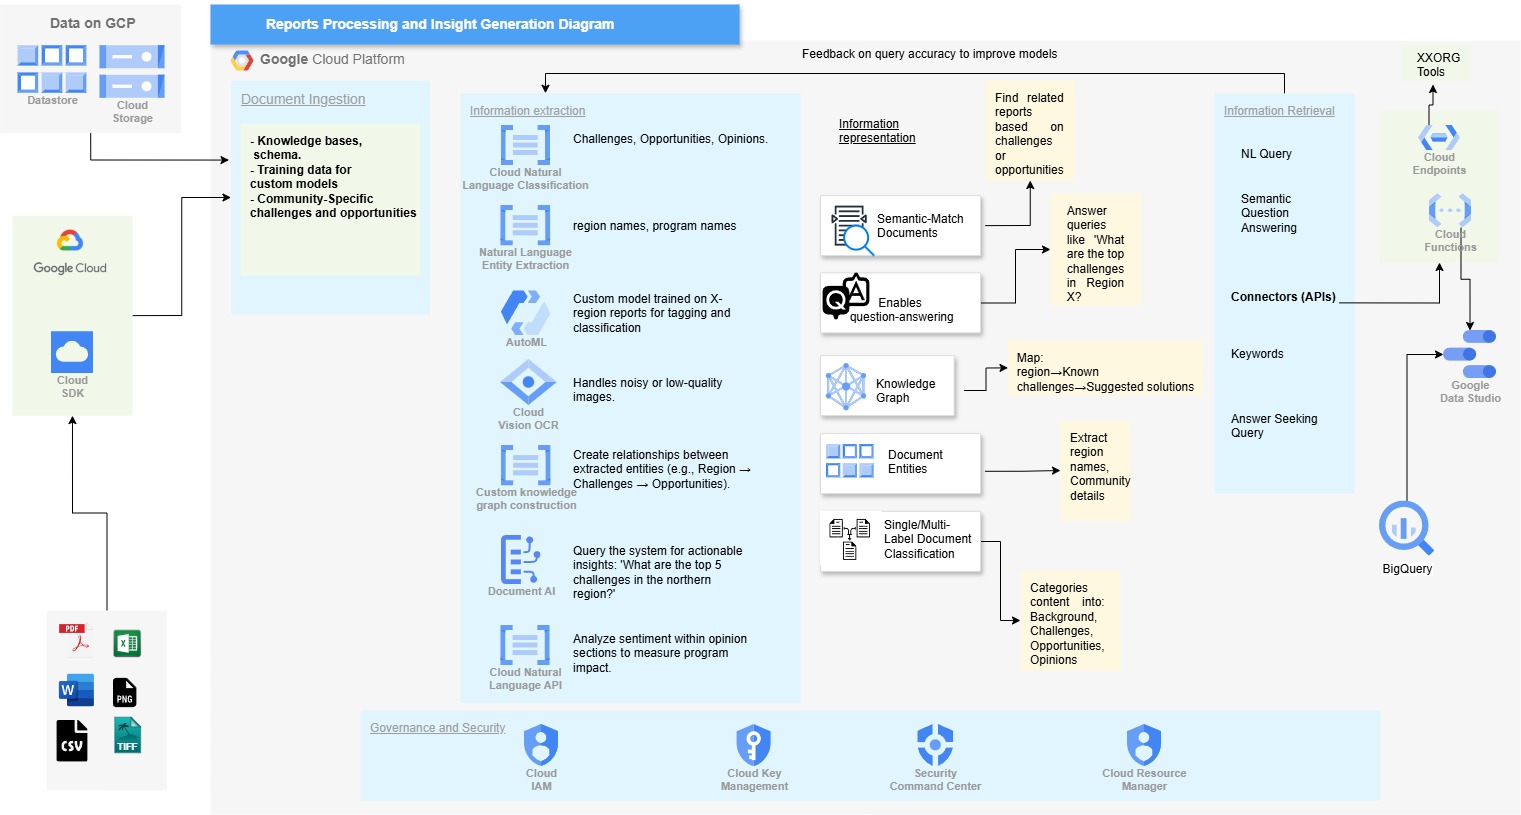
Reports Processing Architecture: End-to-end GCP architecture: Data ingestion → Document processing (OCR, NLP, AutoML) → Knowledge representation → Query APIs → Visualization dashboards with governance and security layers.
Multi-Format Data Ingestion
Supports diverse file formats and uses Cloud SDK for seamless upload to Google Cloud Storage.
# Supported Data Formats
formats:
  documents:
    - PDF
    - Word (.docx)
    - Excel (.xlsx)
  images:
    - PNG
    - TIFF
    - JPEG
  structured:
    - CSV
    - JSON
    - XML

# Cloud Storage Configuration
storage:
  bucket: reports-processing-bucket
  lifecycle: 30-day retention
  access: IAM-controlled
AI Processing Pipeline
Multi-stage AI processing using GCP services for text extraction, entity recognition, sentiment analysis, and custom classification.
# Document Processing Pipeline
from google.cloud import documentai, vision, language_v1, automl

def process_document(file_path: str) -> dict:
    # 1. OCR for scanned documents
    vision_client = vision.ImageAnnotatorClient()
    text = extract_text_ocr(vision_client, file_path)

    # 2. Entity extraction
    language_client = language_v1.LanguageServiceClient()
    entities = extract_entities(language_client, text)

    # 3. Sentiment analysis
    sentiment = analyze_sentiment(language_client, text)

    # 4. Custom classification (AutoML)
    automl_client = automl.PredictionServiceClient()
    categories = classify_content(automl_client, text)

    # 5. Knowledge graph construction
    relationships = build_knowledge_graph(entities)

    return {
        'text': text,
        'entities': entities,
        'sentiment': sentiment,
        'categories': categories,
        'relationships': relationships
    }
Knowledge Graph Construction
Maps relationships between extracted entities (regions, challenges, opportunities) for deeper insights.
# Knowledge Graph Construction
def build_knowledge_graph(entities: list) -> dict:
    graph = {
        'nodes': [],
        'edges': []
    }

    # Extract regions, challenges, opportunities
    regions = [e for e in entities if e['type'] == 'LOCATION']
    challenges = [e for e in entities if e['category'] == 'CHALLENGE']
    opportunities = [e for e in entities if e['category'] == 'OPPORTUNITY']

    # Create relationships
    for region in regions:
        for challenge in challenges:
            if co_occur_in_context(region, challenge):
                graph['edges'].append({
                    'source': region['name'],
                    'target': challenge['name'],
                    'type': 'HAS_CHALLENGE',
                    'confidence': calculate_confidence(region, challenge)
                })

    return graph
Natural Language Query API
Enables natural language queries like 'What are the top challenges in region X?' through Cloud Functions and Endpoints.
# Cloud Function for Natural Language Queries
import functions_framework
from google.cloud import bigquery

@functions_framework.http
def query_insights(request):
    query_text = request.json.get('query')

    # Parse natural language query
    parsed = parse_nl_query(query_text)

    # Convert to BigQuery SQL
    sql = build_sql_from_parsed(parsed)

    # Example: "What are top challenges in Region X?"
    if parsed['intent'] == 'top_challenges':
        sql = f"""
        SELECT challenge, COUNT(*) as frequency
        FROM processed_reports
        WHERE region = '{parsed['region']}'
        AND category = 'CHALLENGE'
        GROUP BY challenge
        ORDER BY frequency DESC
        LIMIT 5
        """

    # Execute query
    client = bigquery.Client()
    results = client.query(sql).to_dataframe()

    return {
        'query': query_text,
        'results': results.to_dict('records'),
        'sql_generated': sql
    }
Data Studio Dashboard Configuration
Interactive dashboards for trend analysis, regional insights, and sentiment tracking.
-- BigQuery Views for Data Studio
-- Regional Challenges Summary
CREATE VIEW regional_challenges AS
SELECT
    region,
    challenge_category,
    COUNT(*) as frequency,
    AVG(sentiment_score) as avg_sentiment,
    EXTRACT(YEAR FROM report_date) as year
FROM processed_reports
WHERE category = 'CHALLENGE'
GROUP BY region, challenge_category, year;

-- Sentiment Trends Over Time
CREATE VIEW sentiment_trends AS
SELECT
    DATE_TRUNC(report_date, MONTH) as month,
    region,
    AVG(sentiment_score) as avg_sentiment,
    COUNT(*) as report_count
FROM processed_reports
GROUP BY month, region
ORDER BY month DESC;

-- Top Opportunities by Region
CREATE VIEW top_opportunities AS
SELECT
    region,
    opportunity_text,
    confidence_score,
    ROW_NUMBER() OVER (PARTITION BY region ORDER BY confidence_score DESC) as rank
FROM processed_reports
WHERE category = 'OPPORTUNITY'
QUALIFY rank <= 5;
Challenges
Processing diverse file formats and unstructured data at scale. Extracting meaningful insights from noisy, low-quality documents. Building relationships between entities across different reports. Ensuring accurate sentiment analysis and entity recognition. Managing security and governance for sensitive report data.
Solutions
Implemented multi-stage GCP pipeline: Cloud Storage for ingestion → Document AI + Vision OCR for text extraction → Natural Language API for entity/sentiment analysis → AutoML for custom classification → Knowledge Graph construction → BigQuery for structured storage → Data Studio for visualization. Added feedback loops to improve ML model accuracy over time.
Results
Successfully automated processing of large report volumes. Enabled natural language querying ("What are top challenges in region X?"). Built interactive dashboards showing trends and insights. Achieved robust security with Cloud IAM and Key Management. Created scalable architecture handling diverse data formats with high accuracy.
Technologies Used
Google Cloud PlatformAutoMLBigQueryCloud Vision OCRNatural Language APIDocument AICloud FunctionsData Studio